
Process & master data
- Forecast-to-collection flow, step by step
- Where data is typed twice or approved offline
- Who owns product, customer, distributor and price records
Typical gap · Duplicate masters, re-keyed orders
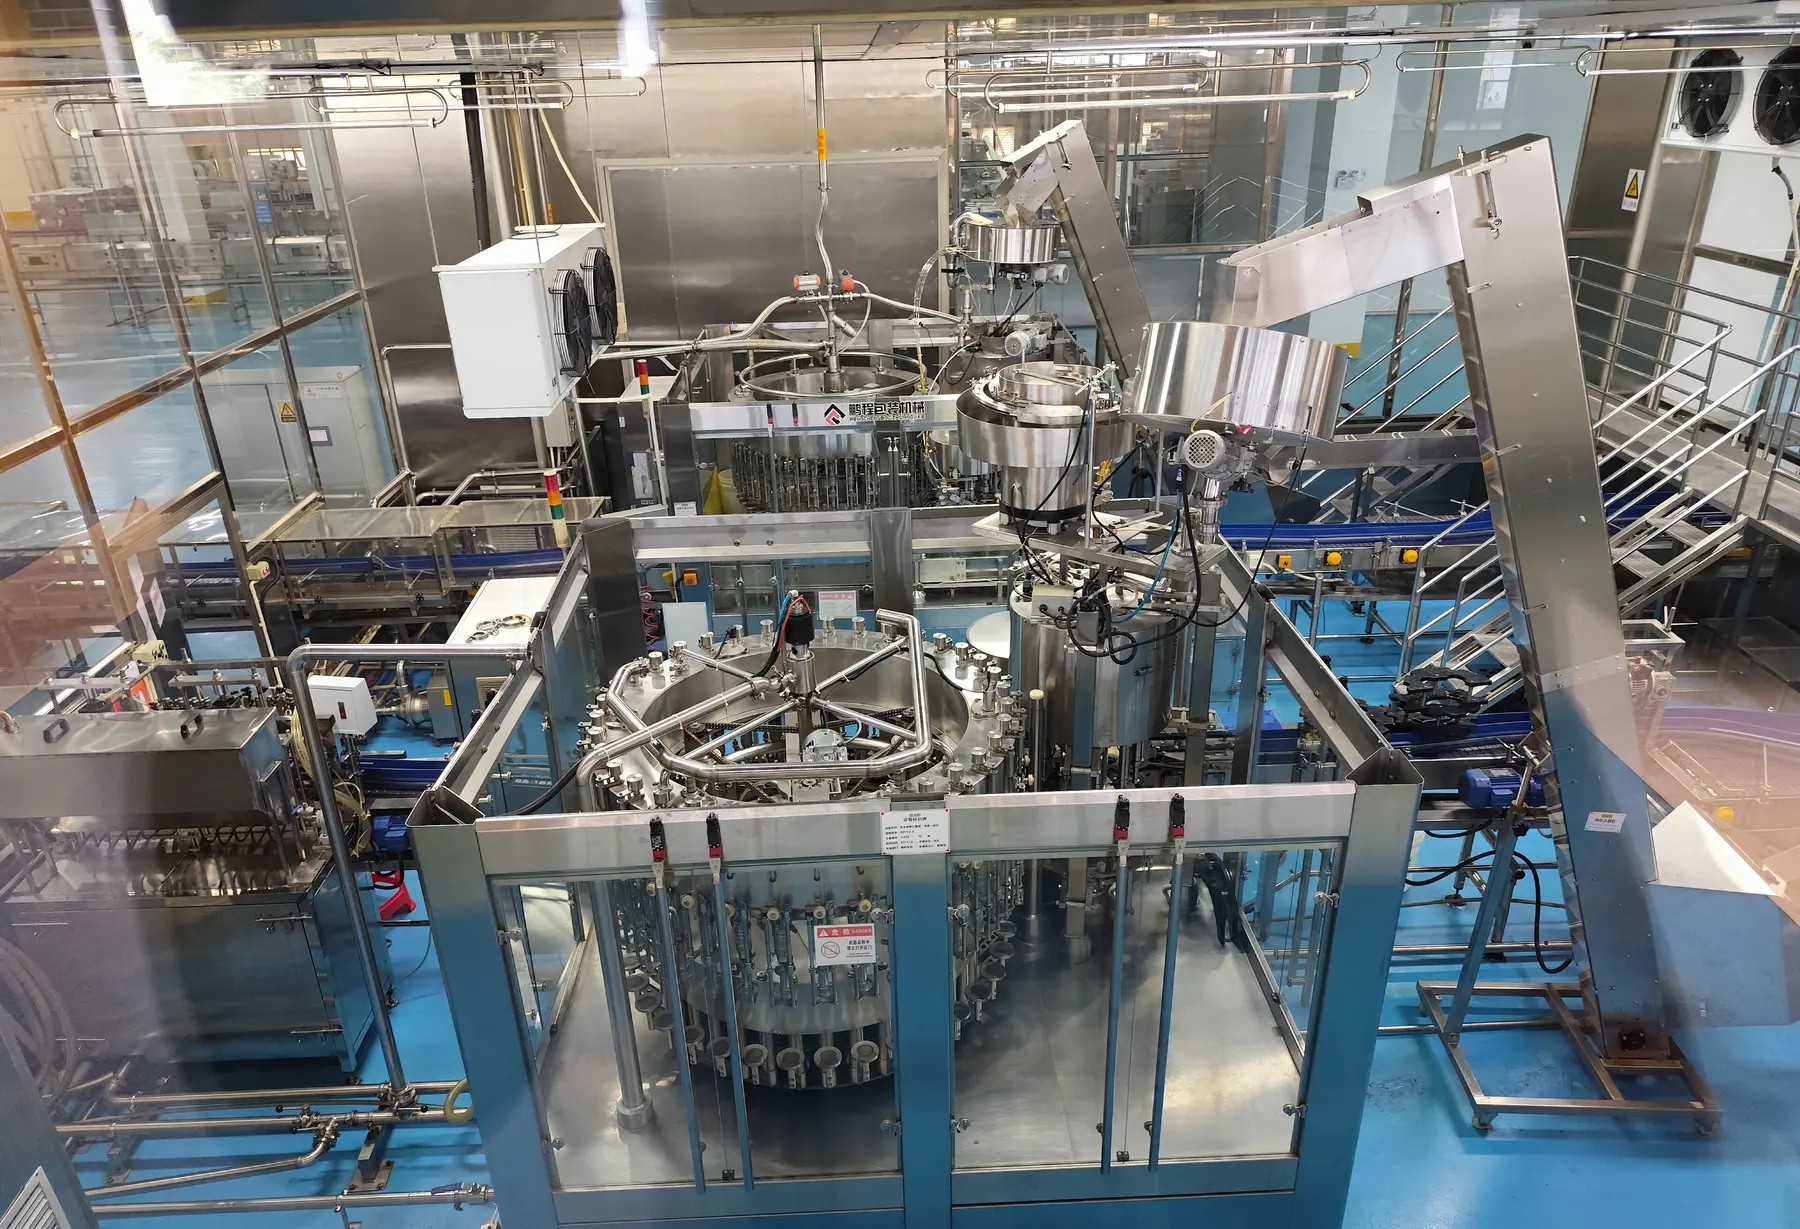
For multi-plant food and beverage makers: a diagnostic of sales, supply chain, finance, plants and technology — then the fixes, built on Mars, in the order that pays back first.


From the plant to the shelf — and every depot in between.
Most food businesses don’t lack systems. They lack one version of the truth between them — and the gaps cost margin, stock and time every day.
Stock that sits in the wrong depot expires there. Without batch and expiry visibility, write-offs show up after the damage is done.
Distributor schemes, damages and display claims are checked by hand, so duplicates and over-claims are paid before anyone notices.
ERP, distributor systems, warehouses, D2C and marketplaces each hold a different number — and none of them is the plan.
Demand plans, purchase plans and production schedules are made in separate meetings, from separate spreadsheets.
Orders re-keyed, approvals on email, reconciliations at month end. Every extra SKU makes it slower.
How a recipe is scaled, how a claim is checked, how a distributor is onboarded — when someone leaves, it leaves too.
The transformation is scoped from what the diagnostic found — not from assumptions or a product list.
Eleven modules across the business and the plants. Every gap traced to its cause.
Maturity scores, baseline KPIs and a ranked roadmap of what to fix first.
Seven modules delivered on Mars and your existing systems, wave by wave.
The same KPIs tracked against the baseline, so every wave shows what it changed.
We follow the work across functions, not just inside them — because the expensive gaps are in the handoffs.
Business, commercial & technology
Typical gap · Duplicate masters, re-keyed orders
Typical gap · Unvisited outlets, unchecked claims
Typical gap · Workarounds around the ERP
Typical gap · Expiry found at dispatch
Typical gap · Slow close, blind margins
Typical gap · Spend without proof
Typical gap · Paying for unused features
Typical gap · Knowledge in a few heads
Manufacturing excellence
Typical gap · Costing from estimates
Typical gap · Plans that never meet
Typical gap · Rejections without CAPA

Plant data tested end to end: batch, quality and cost.
Orders arrive from the field, distributors, modern trade, D2C and marketplaces. We follow each one through order, dispatch, invoice and collection — and mark every place it is re-typed, held up or reconciled by hand.
Prioritised roadmap · value against effort
Baseline KPIs · measured before anything changes
Each module improves the process first, then puts it on Mars and connects it to the systems you keep. Scope and sequence come from the diagnostic.
One way of doing each critical process — approvals, exceptions, SOPs and who owns each master record.
On Mars
Less rework, stronger control, room to scale.
Your ERP, field sales and distributor systems keep running. Mars connects them, fills the process gaps between them, and gives every function one set of dashboards and AI insights on the same data. A platform is migrated only when the diagnostic shows it is the genuine blocker.

Process mapped with the people who run it.


Because the right first move is rarely the obvious one. The diagnostic shows where the money and time are actually lost, so the transformation is sequenced from evidence — not from a vendor’s product list.
 01Live demo
Asset register, preventive schedules, breakdowns, work orders, dashboards.
Fits: Manufacturing, automotive, defense
Explore 02Live demo
Inspection checklists, evidence capture, non-compliance, corrective actions.
Fits: Manufacturing, defense, infrastructure
Explore03Purchase requests, approval chains, vendor coordination, status tracking.
Fits: Industrial, multi-location
Explore 04
Digitize recurring tasks, assign owners, track completion and exceptions.
Fits: Almost every industry
Explore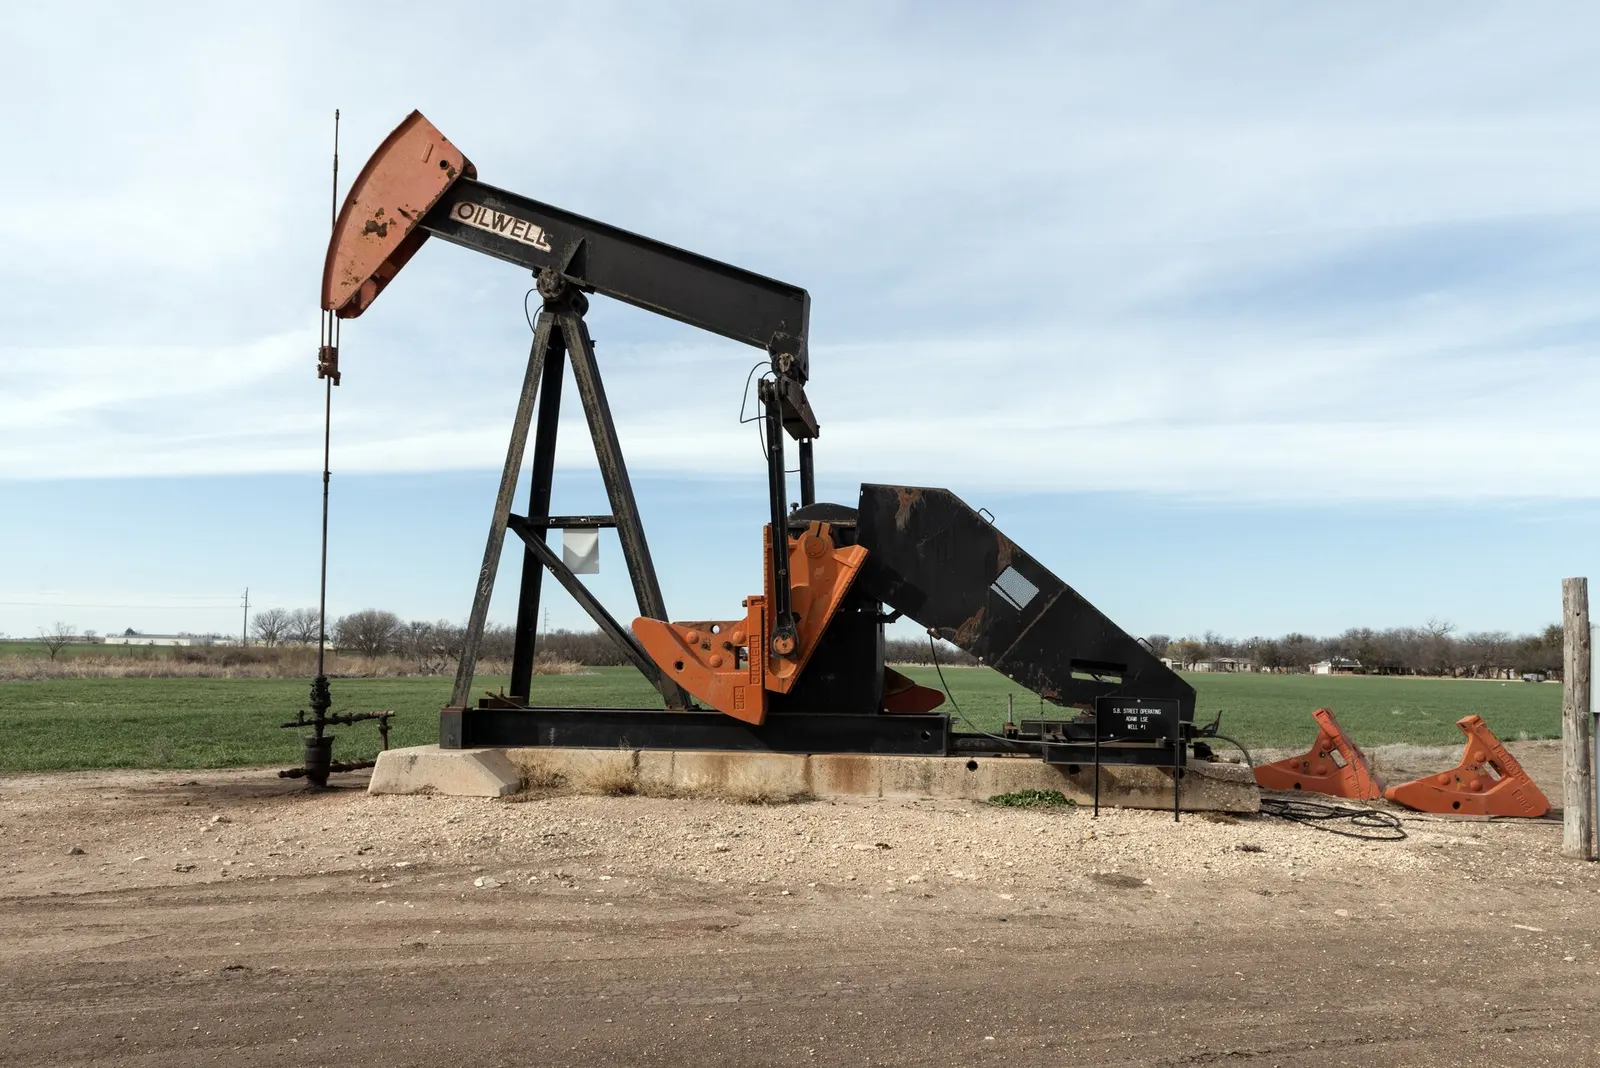 05
Price book, quotes, dispatch, field tickets, custody and invoices on one record.
Fits: Rental, wireline, pump and cable service companies
Explore 06
Outbound, LinkedIn, social posts, SEO pages and ad reporting run by agents, with approvals.
Fits: Growth, demand-gen and RevOps teams
Explore 08
Projects to commissioning, global field service, turnarounds and a 24-hour aftermarket on one record per unit.
Fits: Engineered-to-order industrial equipment OEMs
Explore 09
Every lead called by an AI agent, qualified, followed up on WhatsApp and tracked to won or lost in your CRM.
Fits: Developers, brokers and real-estate sales teams
Explore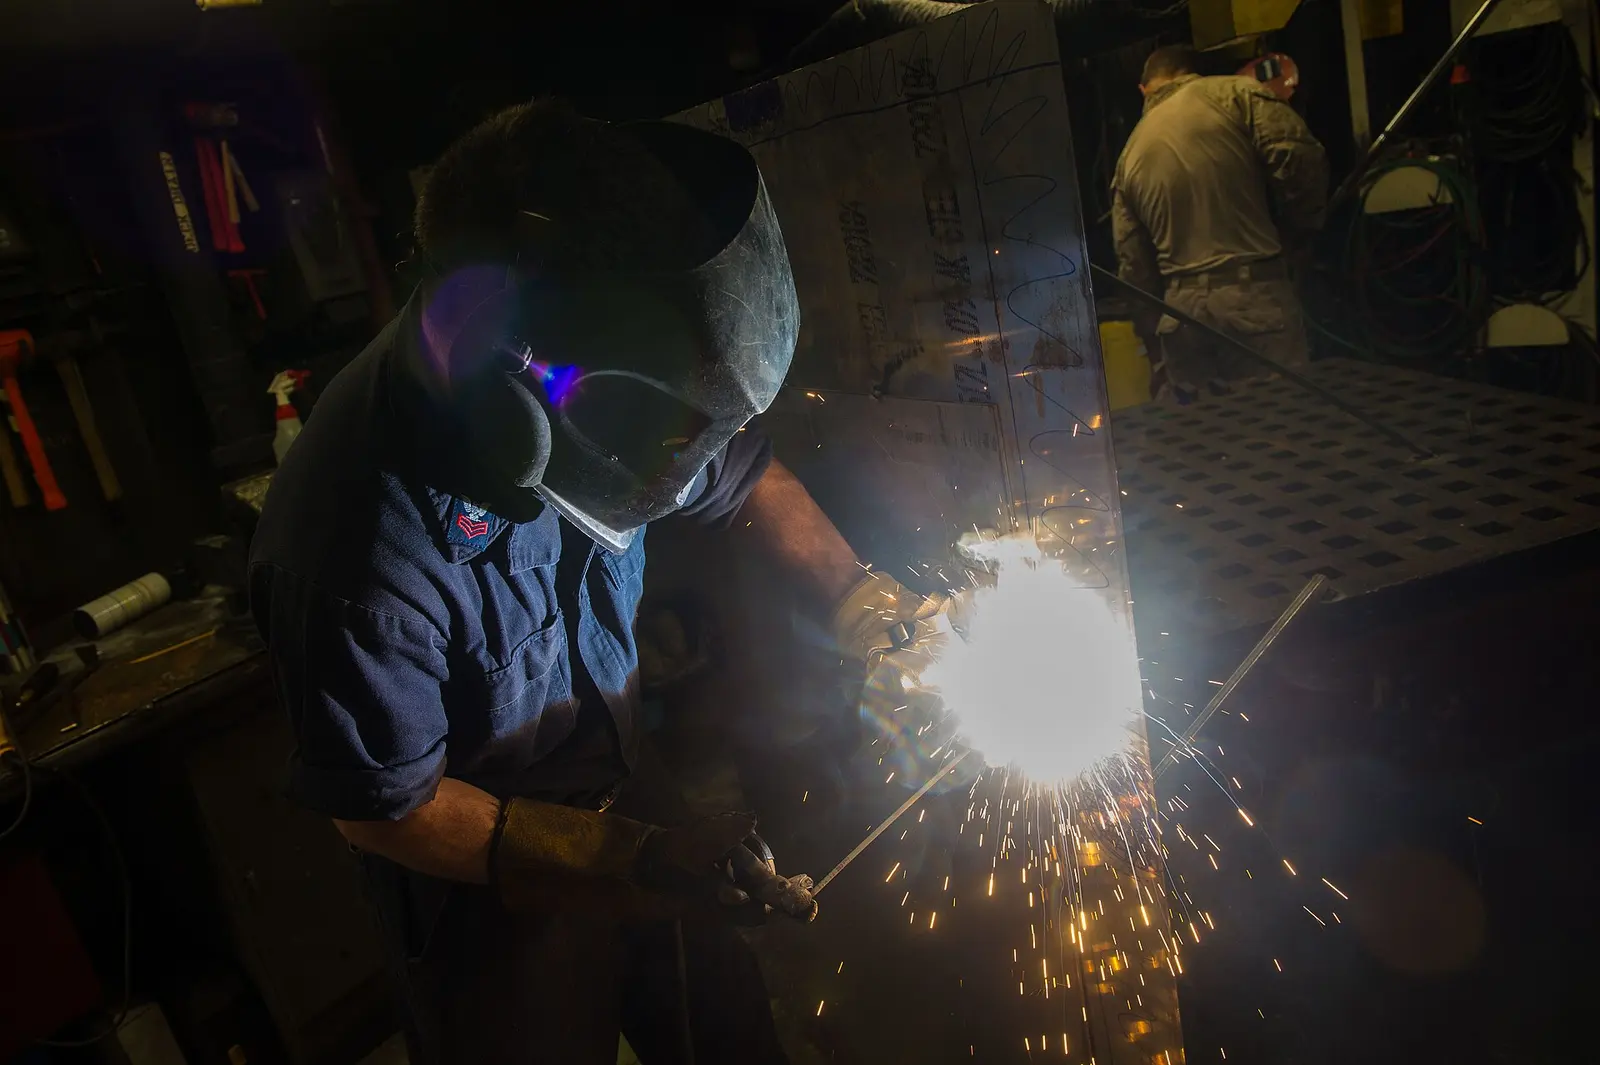 10
QR-verified certificates for lifting, downhole and drilling equipment that can’t be quietly edited.
Fits: Oil & gas inspection and testing companies
Explore 11
Caller, Scribe, Nurture and Reviver agents move every Meta lead from first call to warm buyer.
Fits: Developers and real-estate sales teams
Explore 12
Request, draft, AI review, approve, sign and track every contract — with renewal and obligation alerts.
Fits: Legal, procurement and sales teams
Explore 13
Incidents, requests, problems and changes with AI triage, SLAs and a self-service portal.
Fits: IT service desks and operations teams
Explore 14
Hardware, software and SaaS in one register — lifecycle, licences, renewals and audits.
Fits: IT, finance and security teams
Explore
Start with a diagnostic across your plants, channels and functions — and leave with a roadmap your board can sign off.
Plan a diagnosticBuilt on Mars, the AI-native agentic operations platform.